Welcome to Shade
SHADE is a Shiny application for providing support to researchers in design of experiments. It includes a tool to perform power analysis for usual test statistics, as well as a reporter tool to draft the ethics committee form for animal experimentation (CETEA), in a user-friendly interface. Initially created to design experiments using animals, SHADE might be used to design any experiments (cell culture ...).
Latest news
12/01/2026
SHADE gets a makover
SHADE version 4.0 offers a new user interface to facilitate navigation. You can now run a quick power analysis, or choose the guided section to get a detailed analysis according to your experimental design.
01/03/2023
New version of SHADE is online
User interface improved with an advanced tab for exploring parameters and language option in final report. Cage effect visualisation was also improved.
01/02/2021
Version 2.0 released
User interface was improved with validation buttons, tabs for exploring parameters. Bugs were fixed such as external data loading and numerical errors in power analysis.
01/01/2019
SHADE is online
Implementing power analysis for frequently used statistical tests, power graph and a report for CETEA form.
Team


Power Analysis
Test settings
Choose the appropriate statistical test for your data.
Hypothesis testing
Select a one-sided test if you already know in which way your effect is going to impact the measured variable (increase only or decrease only). If you have no prior knowledge on the effect you are trying to measure, a two-sided test is more suitable.
Experimental design
Nested or crossed design
Will the individuals of the same cage receive the same treatment (nested) of different treatments (crossed) ?
Add unwanted/external sources of variation
Unwanted sources of variation, such as technical factors, can impact the measures during the experiment. It is possible to take them into account during the power analysis, to have a more accurate estimation.
Power analysis parameters
Power Analysis
Guided analysis
General parameters
Select pathway
Compute power analysis
Download report
This section is not finished yet : do not hesitate to contact us if you encounter any bugs, or if you have some suggestions ! You can use our mail alias : shiny-stats@pasteur.fr
Experimental plan
Will the individuals of the same cage receive the same treatment ?
Unwanted effetcs
Unwanted sources of variation can impact the measures during the experiment. Those arre usually technical factors such as cage, repetition of the experiment, batches ... Taking them into account during the power analysis helps to have a more accurate estimation.
Are there any potential external factors in your design that you would like to include ?
Test settings
Pairing
Will all the measured be completely independent (unpaired) or are you are following the same individuals through time (paired) ?.
Hypothesis testing
Select a one-sided test if you already know in which way your effect is going to impact the measured variable (increase only or decrease only). If you have no prior knowledge on the effect you are trying to measure, a two-sided test is more suitable.
Guided analysis
General parameters
Select pathway
Compute power analysis
Download report
This section is not finished yet : do not hesitate to contact us if you encounter any bugs, or if you have some suggestions ! You can use our mail alias : shiny-stats@pasteur.fr
What variable do you want to estimate ?
Depending on the information and data at your disposition, choose the option that fits best :
Guided analysis
General parameters
Select pathway
Compute power analysis
Download report
This section is not finished yet : do not hesitate to contact us if you encounter any bugs, or if you have some suggestions ! You can use our mail alias : shiny-stats@pasteur.fr
Additional informations
In order to compute the power analysis, we need a few additional informations :
Preliminary data
double-click to edit cell
Estimated effect
Guided analysis
General parameters
Select pathway
Compute power analysis
Download report
This section is not finished yet : do not hesitate to contact us if you encounter any bugs, or if you have some suggestions ! You can use our mail alias : shiny-stats@pasteur.fr
Additional informations
In order to compute the power analysis, we need a few additional informations :
Preliminary data
Unwanted effects
Enter below the factors of your experiemnt that might introduce biases in your data. All selected unwanted effects will be regrouped to be modelized as "units". On average, a unit effect can represent between 10% and 20% of the total variability.
Power analysis parameters
Those values are conventionnaly set at 5% for false positive rate and 80% for power, feel free to modify them according to the specificities of your field :
Guided analysis
General parameters
Select pathway
Compute power analysis
Download report
This section is not finished yet : do not hesitate to contact us if you encounter any bugs, or if you have some suggestions ! You can use our mail alias : shiny-stats@pasteur.fr
Power analysis results
Type I error
Power
Effect size
n per group
Interpreting effect size
Analysis summary
Below is a summarised report you can copy/paste to the DAP document, to be reviewed by statisticians. You can also download a summary of the analysis to keep track of what parameters were used.
SHADE team
SHADE is an application developed by members of the Hub of Bioinformatics and Biostatistics of the Institut Pasteur.
It provides support to Pasteur research units in Bioinformatics and Biostatistics. The list of the services offered by the Hub are detailed hereafter:
- Short questions : if you have a simple question about bioinformatics and / or statistics, you can ask your question on this website . A mail is sent to all Hub members and one of them will answer you within a few hours.
- Open desk : come and discuss about your data, your project, your analyses or just about bioinformatics and (bio-)statistics every Tuesday morning from 10 to 12 in Yersin Building (24) 1st Floor. Hub members with complementary fields of expertise will be ready to answer your questions and discuss with you.
- Collaborative projects : you are starting a project or you are planning experiments? You need advice and / or help in bioinformatics and (bio-)statistics to design your experiment and analyze your data, or develop a specific software? Please submit a project here . Dedicated Hub members can be involved in your project from the beginning.
You may find more information about the Hub of Bioinformatics and Biostatistics on the team webpage .
Click here to contact the SHADE authors by email.
Contributors
Acknowledgements


Check out our other applications
We developped other Shiny apps to help you with experimental design. Do not hesitate to have a look !
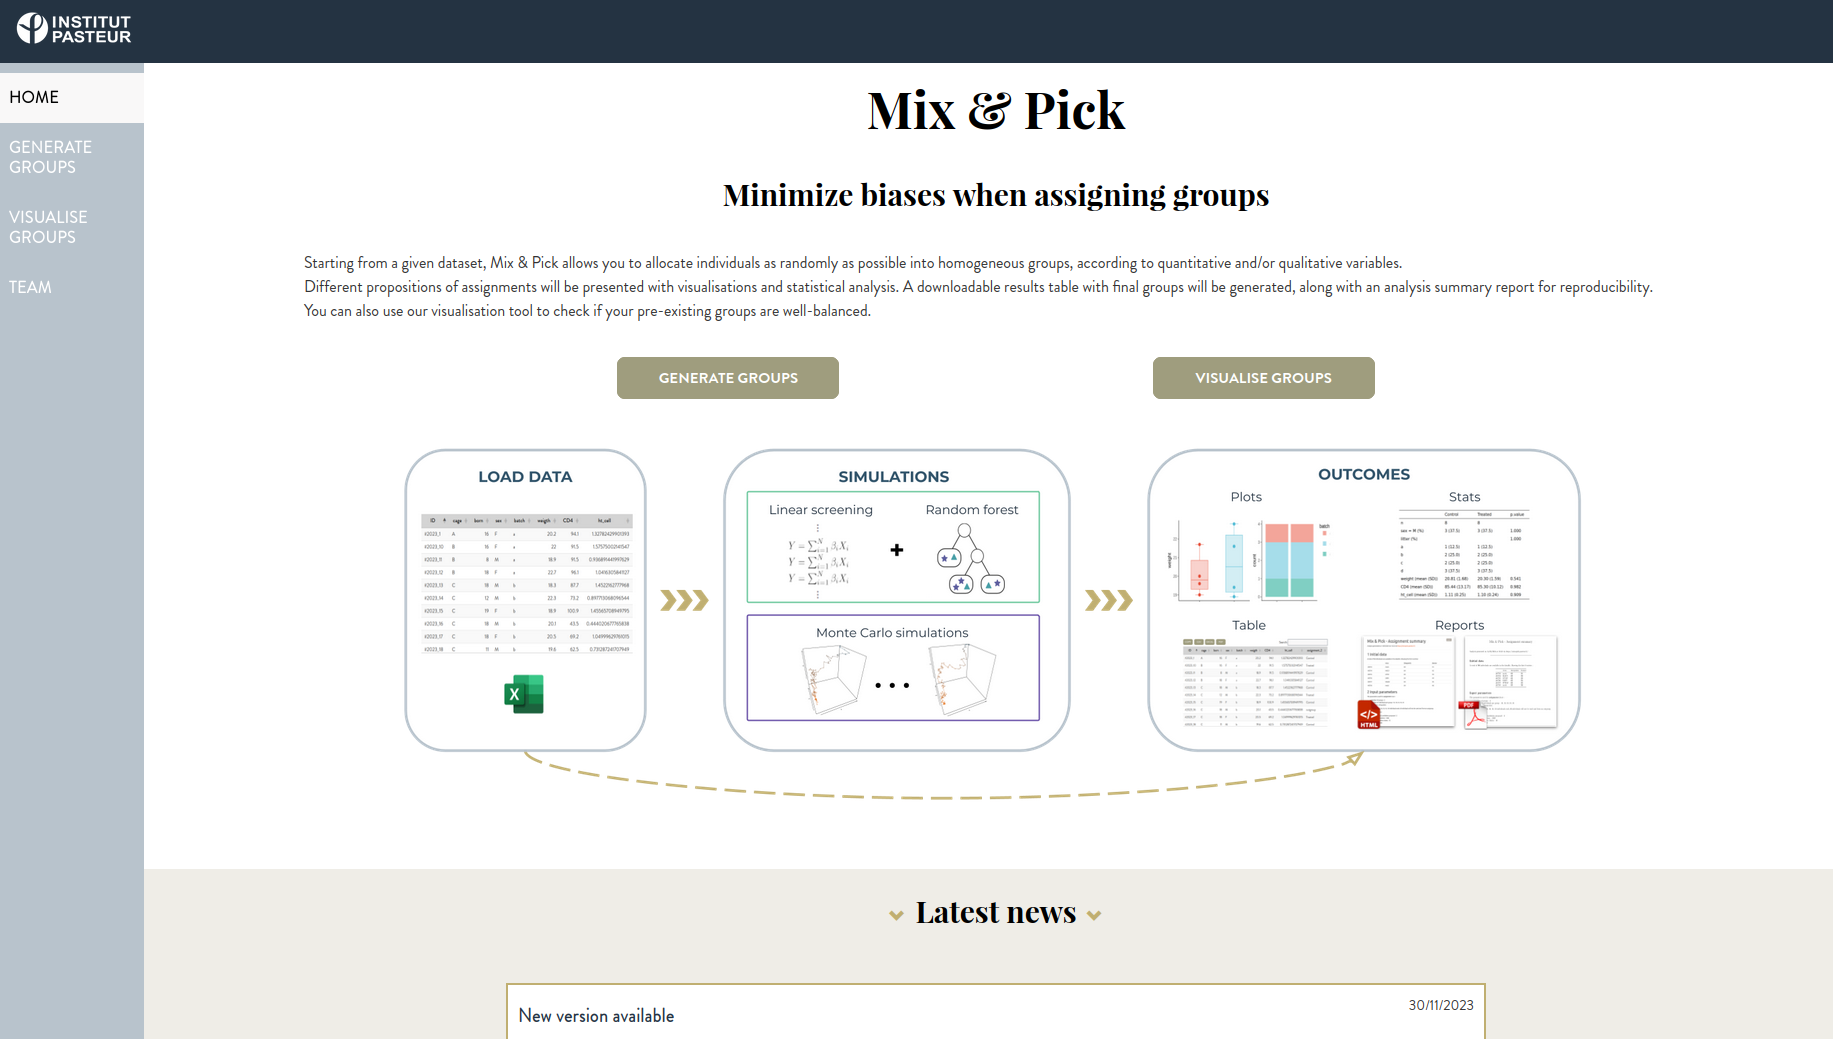
Mix&Pick : Radomization tool
Minimize biases when generating group assignments
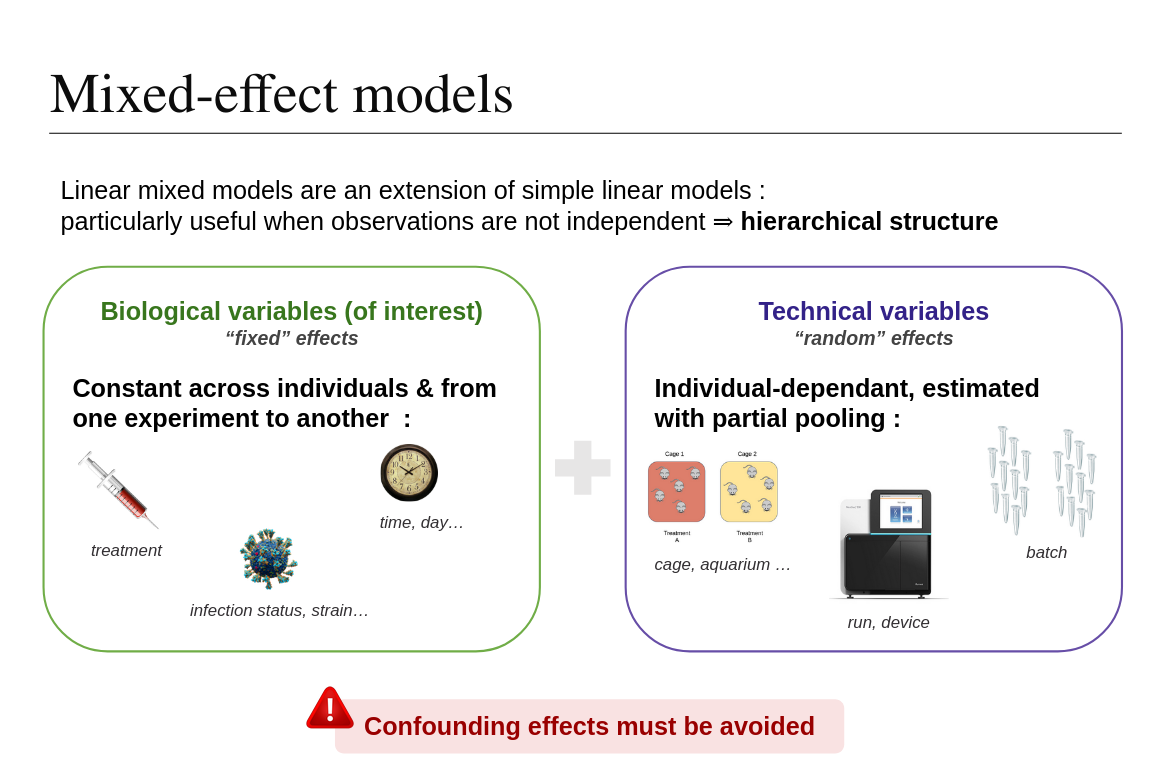
User-friendly Mixed Models analysis
Perform statistical analysis with structured data